Strategic Employee Value Proposition Design with Relational Analytics and Attrition Risk Modeling


This article is a recap of the Panalyt x PeopleOPTI webinar “Great Resignation Accelerates: Predicting Attrition Risk & Understanding Drivers” in which Daniel West & Federico Barcos Von Der Heide discussed how companies can improve retention in the wake of the Great Resignation by improving their Employee Value Proposition with People Analytics & Relational Analytics / ONA. We have also incorporated EX elements from another webinar “Strategic EX Design with People Analytics” with Sasha Wight from Wrkflow.
Table of Contents:
- Great Resignation Accelerates: A Need for a Data-Driven HR Management Approach
- A Modern Data-Driven Approach For Designing Employee Value Proposition (EVP)
- Data-Driven EVP Design: People Analytics in Action
- Relational Analytics: Utilizing Digital Communications and Collaboration Data
- Relational Analytics: Identifying Influential Leaders
- Relational Analytics: Strategically Improving Engagement and Collaboration
- Relational Analytics: Engagement/ Attrition Risk
- Predicting Attrition Risk and Understanding Drivers
- Understanding and Reducing the Snowball Effect of Attrition
- Bonus: Utilizing Attrition Risk Data for Strategic EX Design
- Effective Knowledge Sharing to Replace Someone Leaving the Organization or Changing Roles
Great Resignation Accelerates: A Need for a Data-Driven HR Management Approach
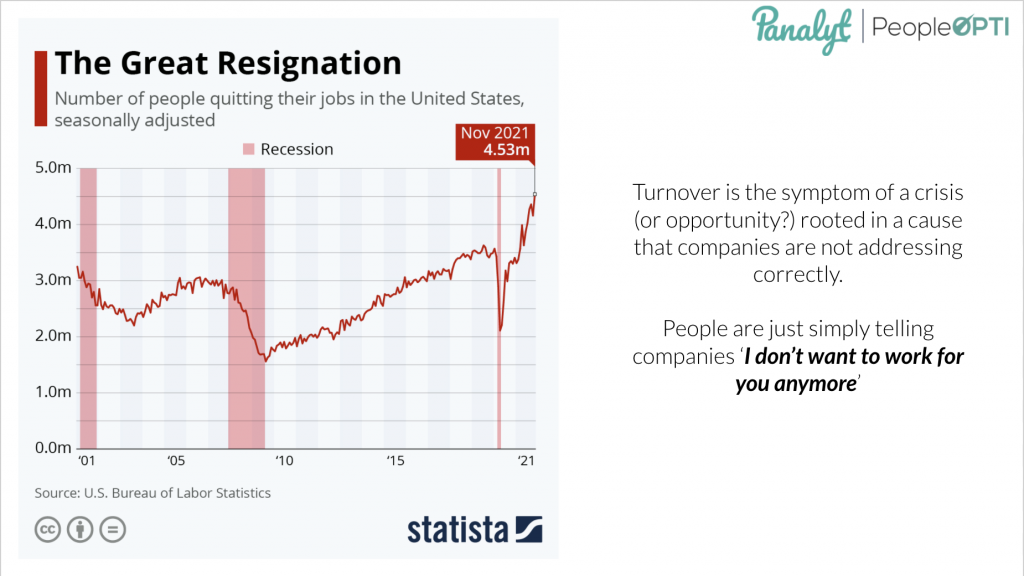
The Great Resignation/ Attrition/ Reset/ Onboarding needs no introduction. 4.53 million US workers left the workforce in Nov 2021, and this number is only expected to go higher once companies finish their end-of-year compensation and bonus cycles.
At this scale, companies have previously seen a radical reorganization of their workforce during preicious financial crisises such as the dot-crom crisis and the 2008 Wall Street financial crisis but the massive change this around is that it is not companies laying off employees, but rather employees leaving voluntarily.
Attrition is a symptom, not the root cause. People Analytics allows HR departments to use the people data that is gathered across different systems and files used across the employee lifecycle to understand the real drivers of attrition.
There is a need to truly understand why employees are leaving the company – which is a huge challenge for traditional HR approaches that rely on anecdotal evidence. More so, because employees don’t want to just blindly go back to pre-2020 work arrangements, there is a massive opportunity to utilize people data for better decisions to understand how the Future of Work should look like for each organization and how they want/should be managing their people, whether it’s a hybrid, 100% remote or back to office model.

HR departments have traditionally flocked around best practices implemented at leading organizations, such as pay for performance or a common approach towards D&I, but we are not seeing a common thread this time. There are no clear universal guidelines for “Hybrid” working arrangements.
A starting point for utilizing data for designing your organization’s working style is to track some very simple yet critical data points being tracked by companies who are thriving whilst shifting to a hybrid work arrangement are:
– when did employees start working from home?
– when did they return to the office?
– track who’s working where on a daily/ weekly basis
– identify differences in manager/ team vs employee work preferences – for example. manager in the office, employees remote or manager remote, employees in the office.
These data points when viewed in conjunction with other data sets like attrition, engagement, performance, etc. can give you a good indicator of the objective impact of work style on individual productivity/ satisfaction, which when paired with the results of your survey/ listening initiatives can help you strategically decide the level of flexibility you wish to provide in working arrangements.
A lot of discussions center around debating in the office vs out of the office, but choosing the right work arrangement for your organization and more importantly for your employee is not just as simple as that. There could be multiple factors that affect an employee’s productivity and satisfaction on the job – different relationships with the boss/team, commute time, etc.
When data is not in the equation, the temptation for most organizations is to go with a 100% remote or back to office approach based on executive preferences or anecdotal evidence is this sub-optimal. Whether banking executives are making decisions to return to the office based on their experience in their careers, or companies blindly copying a remote/ hybrid work model implemented by a top-tech company – there remains a big gap and a need for companies to utilize people data, analytics and listening to understand what would be the work model that works best for their current, and subsequently, their future workforce.
A Modern Data-Driven Approach For Designing Employee Value Proposition (EVP)
The pandemic has been a catalyst to elevate personal purpose and values.
Traditionally, companies have focussed heavily on perks and benefits-oriented to satisfy rational needs. When companies were designing the Employee Value Proposition (EVP) before the pandemic, compensation packages, perks, and benefits used to be the main driver, which was quite straightforward to benchmark against competitors. However, compensation by itself is not enough in today’s world.
A holistic view towards the Employee Experience (EX) has become more important than ever – as employees become more self-aware and deliberate about their choices of where they work, who they work with, and how they work.
This has created a real challenge for companies to redesign EVP and re-think what they have to offer employees to retain them, make them happy and productive, and work in a more collaborative setting regardless of work setting – which is a new issue for many companies.
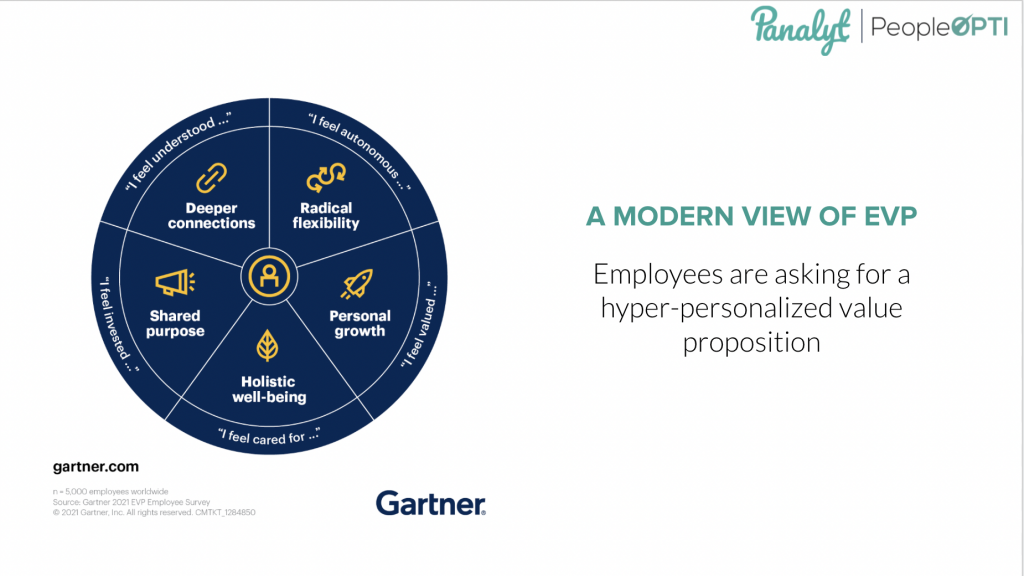
We are now entering an era of creating hyper-personalized value propositions for employees, where HR departments have to build unique value propositions for each employee and give each of them what they need to be more productive/satisfied, and stay with the company for the foreseeable future and beyond.
In order to do this you need data to understand the preferences and behavioral productivity/collaboration patterns of employees, otherwise only going to design a few blanket value propositions for the whole company won’t be enough in the new normal.
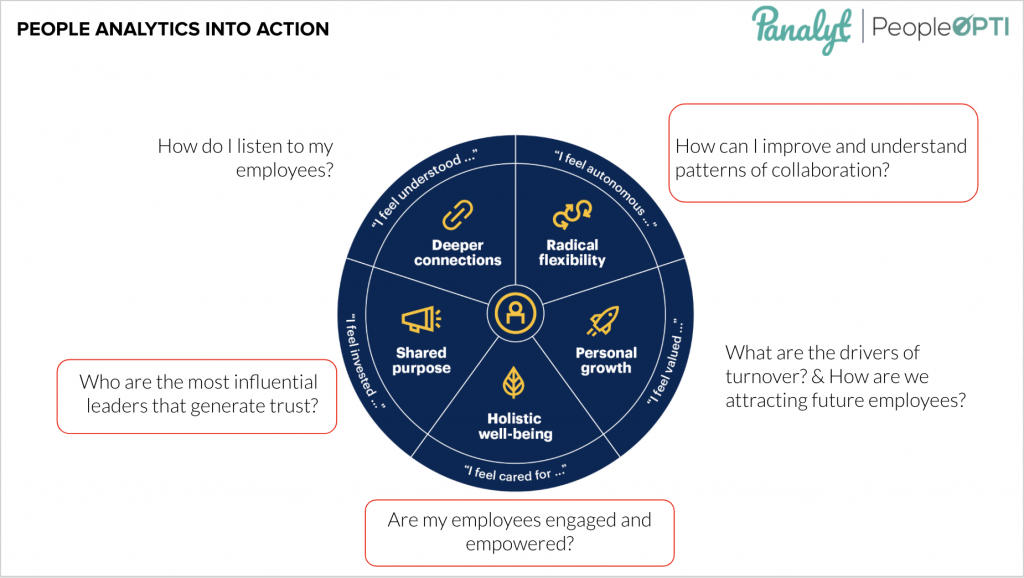
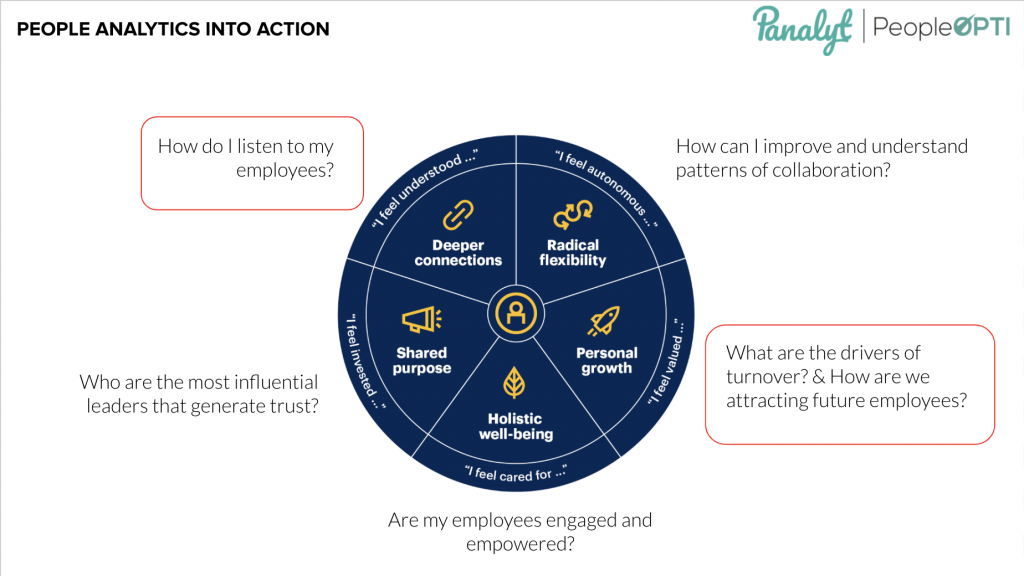
Gartner’s model for “A Modern View of EVP” uses 5 themes to construct the EVP for employees:
- Radical flexibility – ” I feel autonomous…”
- Personal growth – ” I feel valued…”
- Holistic well-being – ” I feel cared for…”
- Shared purpose – ” I feel invested…”
- Deeper connections – ” I feel understood…”
You can only measure the success of your EVP and layout an action plan corresponding to the themes with data, understanding which key metrics/ KPIs from your people data corresponds to the different themes and democratizing access to this data to empower managers and HR business partners to track the progress and success of the EVP for their population in advance of people leaving and having to go through a long and expensive rehiring and onboarding process.
People Analytics is an important tool for HR and executives to empower them to make different decisions about how to manage people
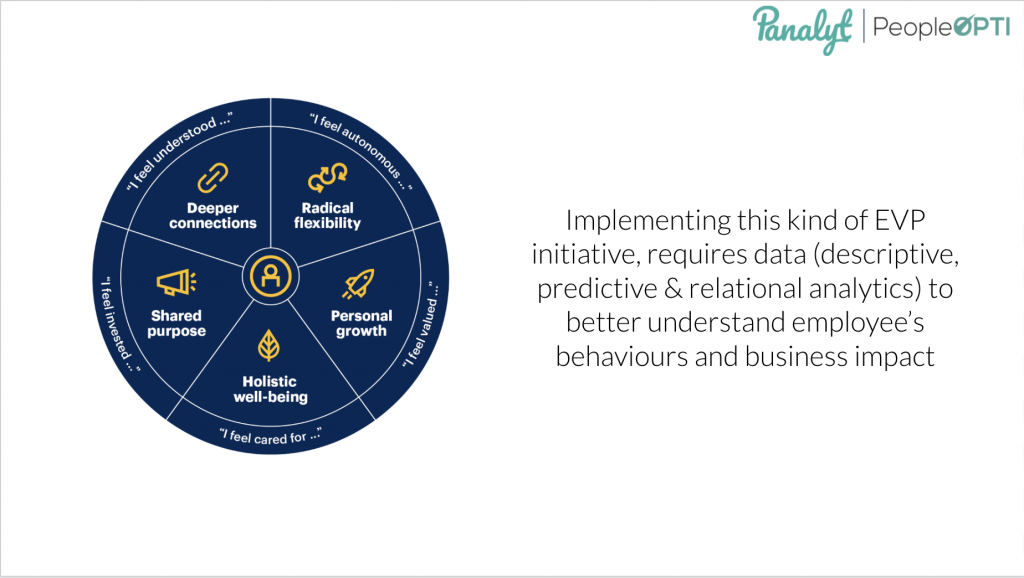
In order to attract, develop and retain top talent in today’s world, the old fashion HR management approach where HR was primarily a reactive function needs to change drastically to utilize people data (descriptive, predictive, and relational analytics) to better understand employees’ behaviors and business impact.
Data-Driven EVP Design: People Analytics in Action
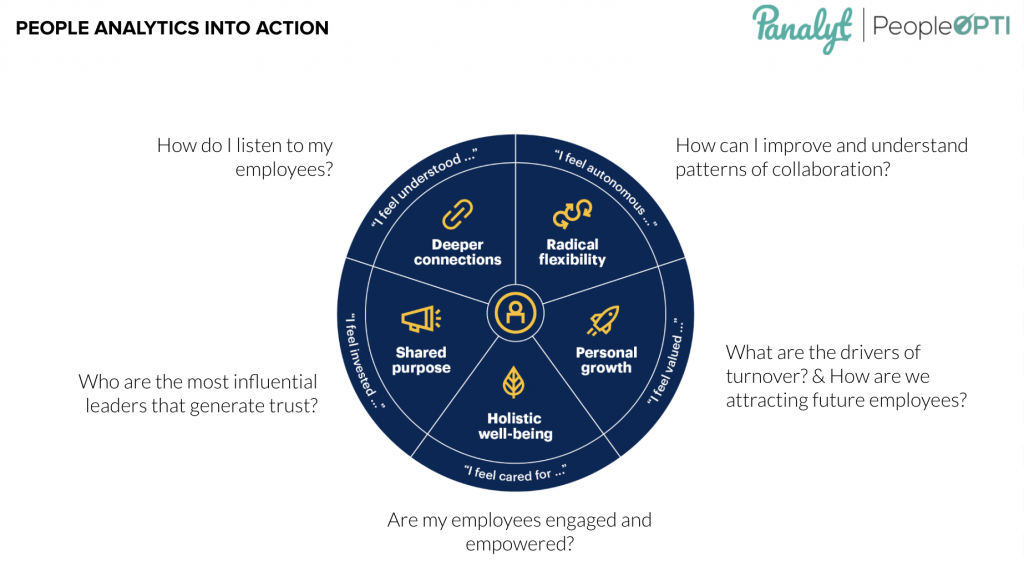
We propose that the different themes in the Gartner EVP model can further be associated with the following problem statements to approach from a People Analytics perspective:
- Radical flexibility – How can I improve and understand patterns of collaboration?
In today’s world, many new hires are joining the organization without meeting their manager and team, or even other new hires they could’ve related to – how can improve patterns of collaboration to integrate them into the company? - Personal growth – What are the drivers of turnover? How are we attracting future employees?
What are the main drivers of attrition and how can we act to improve them in order to both retain talent and attract top candidates in the future? A focus on the quality of hire is also needed as bad hires can indirectly impact attrition due to other team members having to step up and go out of their comfort zone to compensate. - Holistic well-being – Are my employees engaged & empowered?
How do we engage employees to be successful in their jobs whilst improving job satisfaction? - Shared purpose – Who are the most influential leaders that generate trust?
How do we understand who are the influential leaders that create more trust and use those insights to manage our people more effectively? - Deeper connections – How do I listen to my employees?
How do we translate data from surveys and network behaviour into actionable insights to improve business and people metrics?
Practical people analytics, focussed on democratizing and operationalizing access to people data and insights, enables you to set measurable metrics to address each one of these areas that your managers and HR business partners can be held accountable for to support your growth with a holistic data-driven approach.
This approach allows you to empower not only HR but also line managers to engage in different conversations about the people challenges being faced within the company and how the company is preparing for future needs.
While traditionally HR data has been closed within the walls of the HR department, or in many cases siloed within different HR sub-departments, today’s environment requires companies to a more data-driven, agile, and decentralized model for making people decisions, for which is of utmost importance to democratize access to people data beyond HR and the C-suite.
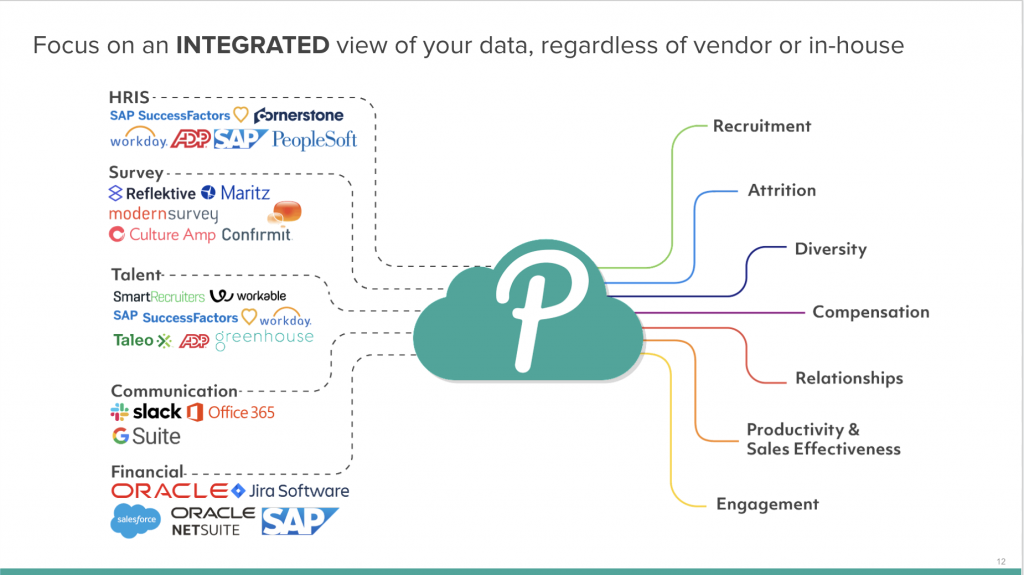
Regardless of whether you’re working with a People Analytics vendor like Panalyt or building your own People Analytics infrastructure in-house, you need to focus on having an integrated view of your people data across multiple source systems and files.
The value your organization can get from People Analytics while trying to improve retention exponentially increases if you can get all data aligned in one place so you can look at attrition data in the context of high performers, engagement surveys, the recruitment process for people who left, etc.
Having a holistic picture of your employee lifecycle across all the people data collected is table stakes for understanding attrition risk and the main reasons for employees leaving.
Relational Analytics: Utilizing Digital Communications and Collaboration Data
Note: At Panayt, we only analyze the metadata of email, chat, and calendar activities ( who from, who to, and timestamp of activity)
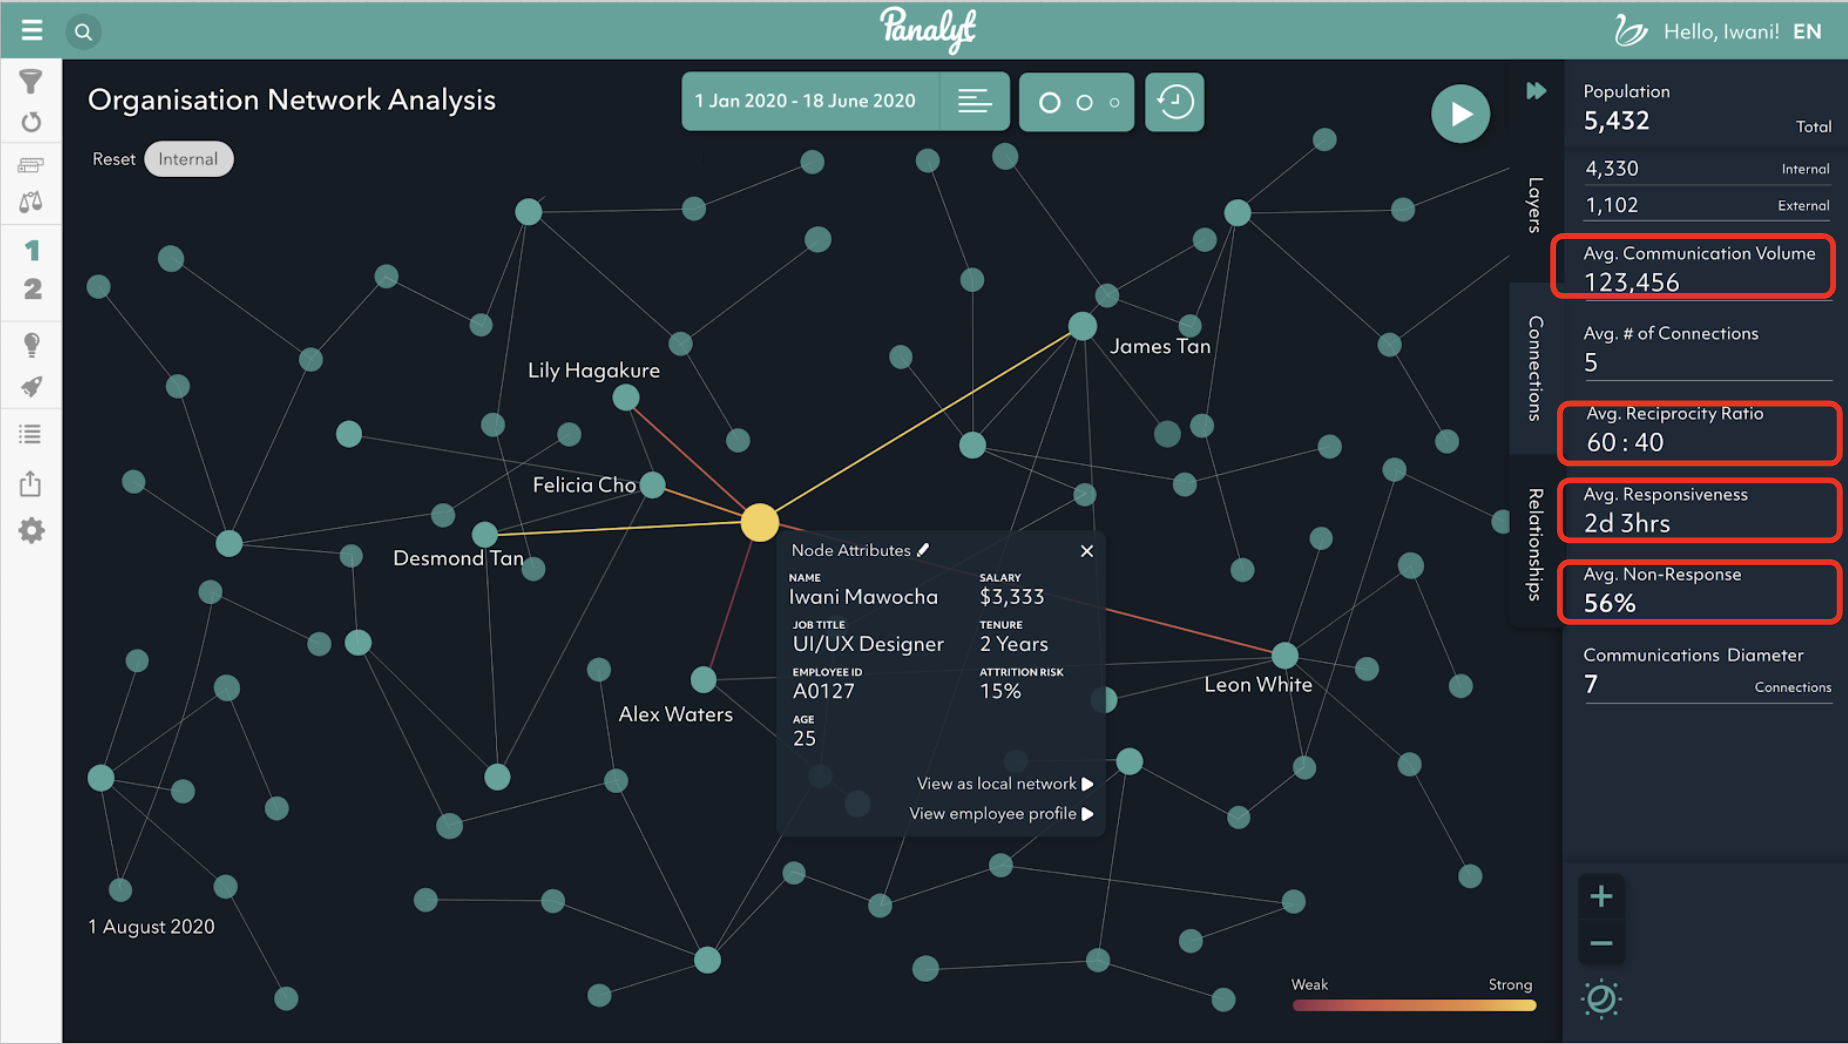
Relational Analytics provides a lens into how work really gets done at your organization by mining behavioral insights from internal and external employee communication and collaboration metadata.
Relational Analytics empowers organizations to understand which employees or groups of employees are disengaging from the organization ( disconnected from their managers, their peers, and the wider organization), and are at a high risk of leaving the company (either they are actively disengaging or they’re being pushed out of the organization.
Using a variety of communication metrics such as volume and frequency of emails, average responsiveness (how quickly do people respond to each other) and reciprocity ratio ( how equally distributed are the communications), etc., a relationship score is calculated between individuals, and the extent to which you have a high relationship score between yourself and another individual, as well as their reciprocal relationship to you, determines whether you have a strong or weak relationship with the other person.

Understanding digital collaboration and Relational Analytics data also lets you answer key questions for your remote Employee Experience such as:
- Are my employees engaged and empowered?
- How can I improve and understand patterns of collaboration?
- Who are the most influential leaders that generate trust?
Relational Analytics: Identifying Influential Leaders
A simple way to understand who are the most influential individuals is to understand who has broad, diverse relationships that can cross organizational boundaries and help influence the wider organization.
Not only does Relational Analytics allow organizations to easily identify influential leaders, but it also enables leaders and managers to understand their own influence within the organization and strategically develop their networks to be in a better position for succeeding in their initiatives.
Most leaders tend to think they have very good networks, but that might not be the reality. The individual view and macro view of different communication and relationship metrics show leaders and managers how well they’re networked with the team and the depth of their relationships. Relational Analytics can be utilized as a strategic management tool for leaders to see if they’re connecting with their team more broadly, and from the HR perspective, show how the leadership team is connected.
Relational Analytics: Strategically Improving Engagement and Collaboration
A simple use case for understanding how Relational Analytics can help in strategically designing a more engaged organization is New Hire Onboarding.
The new hire turnover rate has been very high through the pandemic as most onboarding plans are still built on the same assumptions that were used to design the onboarding experience back when people were in the office.
The lack of engagement with their managers, their teams, and the wider organization as a result of being onboarded remotely has led to recent new hires (on whom a lot of time and money has been spent to recruit, onboard, and develop) being more susceptible to leaving the company early in their tenure as a result of not being well-connected / not being able to integrate into the organization.
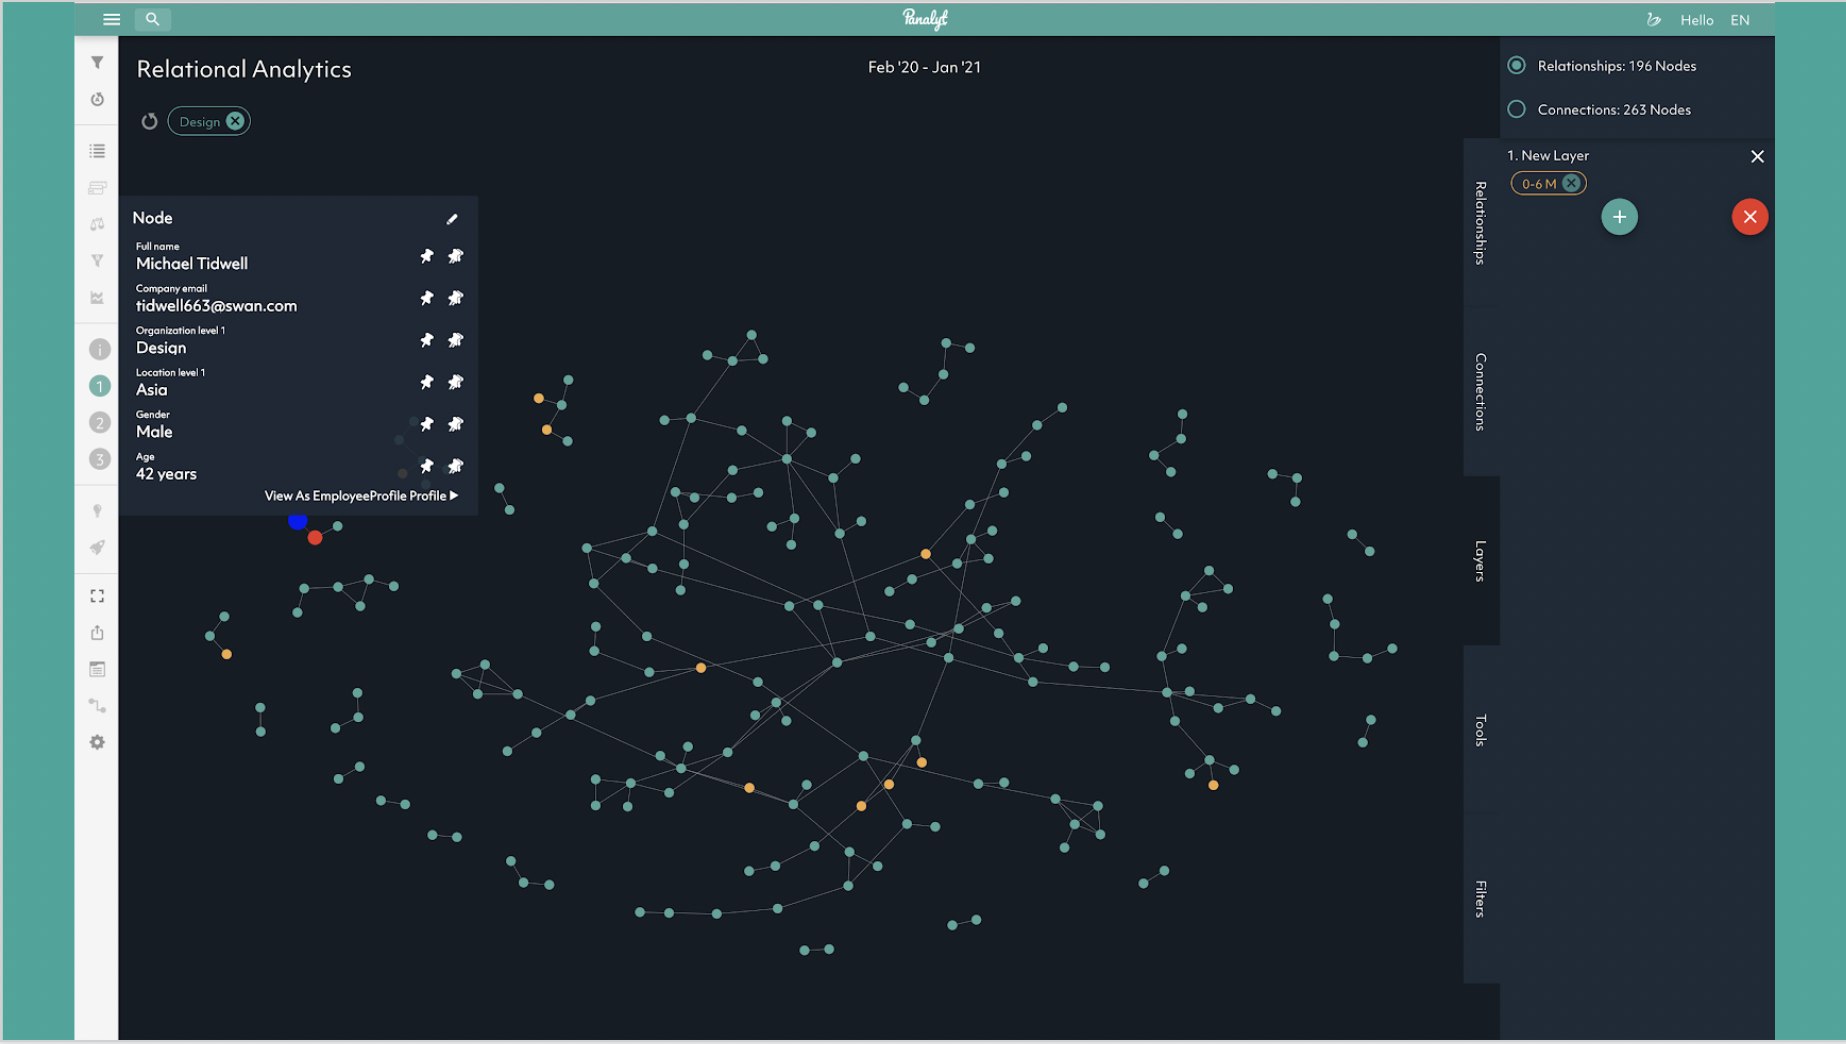
Relational Analytics empowers line managers and HR business partners to understand how new hires are integrating into the organization (new hires who are connecting with the large network within the organization), & identify where to strategically intervene to help new hires build meaningful relationships while working remotely (people connected with a much smaller network, have much more limited access into the organization).
As a business partner, you can identify isolated new hires and then identify who they should be connecting to such as connectors who are at the center of a much larger network.
You can then design practical EX interventions to introduce new hires to connectors – such as working on the same team, working on the same project, having them schedule time together, etc.
Incorporating connectors into your formal employee onboarding buddy programs is also a practical approach to ensuring your new hires are connecting into a larger network.
Real-time visibility into how new hires are integrating into the organization and helping employees build those connections early ensures that employees are productive as quickly as possible & that the likelihood of them remaining with the organization & not leaving in the first six months is higher.


With remote/ hybrid work, the lack of a physical office makes it difficult to understand the dynamics of how a particular team collaborates, and there is an inherent risk in hiring a person and then allocating them to a team that is not working effectively. A new hire is more likely to leave if they are onboarded to a team where there are no strong bonds between the employees on the team.
This makes Relational Analytics a great tool to mitigate the effects of the Great Resignation for new hires, for planning the new hire onboarding experience as well as for responding to what’s happening during onboarding.
Relational Analytics: Engagement/ Attrition Risk
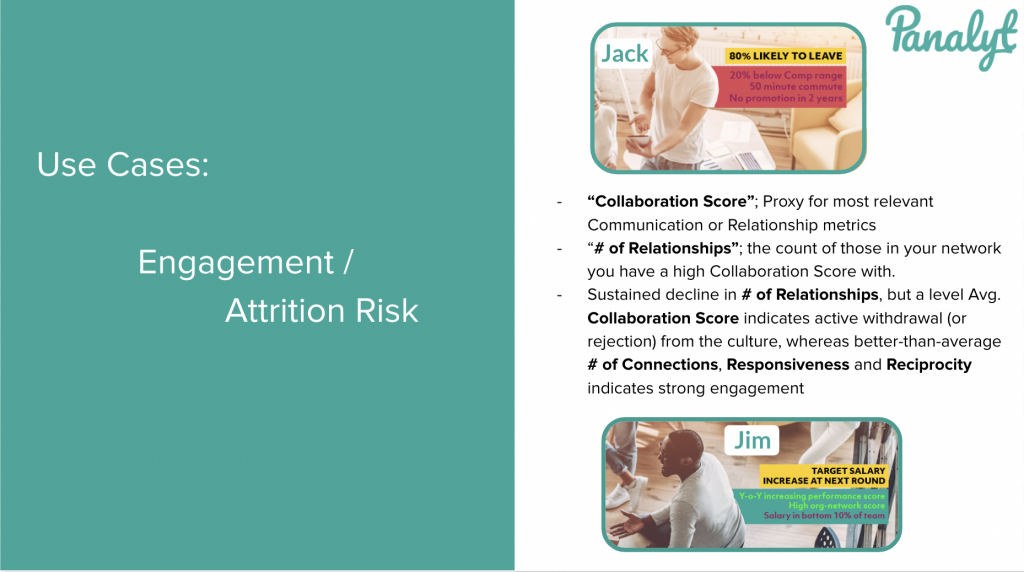
Relational Analytics provides an objective means to look at the engagement of employees by any dimension ( org, location, job grade, age group, etc.) and see trends in engagement levels between teams.
It is also an extremely powerful and accurate means to predict attrition and understand who is either pulling back from or being pushed out of the company culture – if the total # of relationships rapidly declines for an individual but the collaboration score remains level (i.e. stronger relationships with few people while shrinking the wider network), there’s a very high likelihood that person will leave the company.
For example, if someone goes from having 20-30 solid relationships to three or four in a short period, it’s a clear sign that they’re either being excluded from the culture or pulling away from it.
A real-life example from Uber from back when Panalyt CEO Daniel West used to head HR International for the firm:
Uber’s People Analytics team found that the number of meaningful connections was found to shrink rapidly in a sustained manner over 3–4 months before the employees left.
While the average relationship strength with the remaining close connections ( mostly friends within the company) went up, the number of people they had a high relationship strength with within the company decreased drastically.
Exit interviews revealed that these people noticed that they were either pulling back or being pushed out of the company only 3–4 weeks before they left, allowing Uber to have a 3 month lead time to plan necessary interventions for high attrition risk talent.
Identifying and speaking with employees who are disengaging or getting isolated from the organization can help HR leaders and managers identify where to intervene in order to reduce attrition/disengagement. In addition, people who had strong relationships with employees who left the firm can also share further qualitative insights on the possible reasons behind someone leaving the firm.
While Relational Analytics can be an incredibly powerful method to identify which employees are disengaged or at high risk of leaving your organization, it doesn’t give you any context on why that’s happening as the changes in communication/relationship behaviors for an individual is a symptom of a bigger problem and not the root cause.
At Panalyt, our proprietary Machine-Learning driven Attrition/Engagement Risk Prediction model analyzes various data points across both the core HR and ONA data to identify the likelihood of an employee* leaving the firm along with the possible reasons why.
* Analysis can also be limited to cohorts of employees rather than at the individual level if desired
Predicting Attrition Risk and Understanding Drivers
Note: While we are primarily sharing Panalyt’s approach to predicting Attrition Risk, you can also use our approach as a guideline to visualizing and distributing Attrition Risk data in an actionable manner if you’re building your own models in-house.
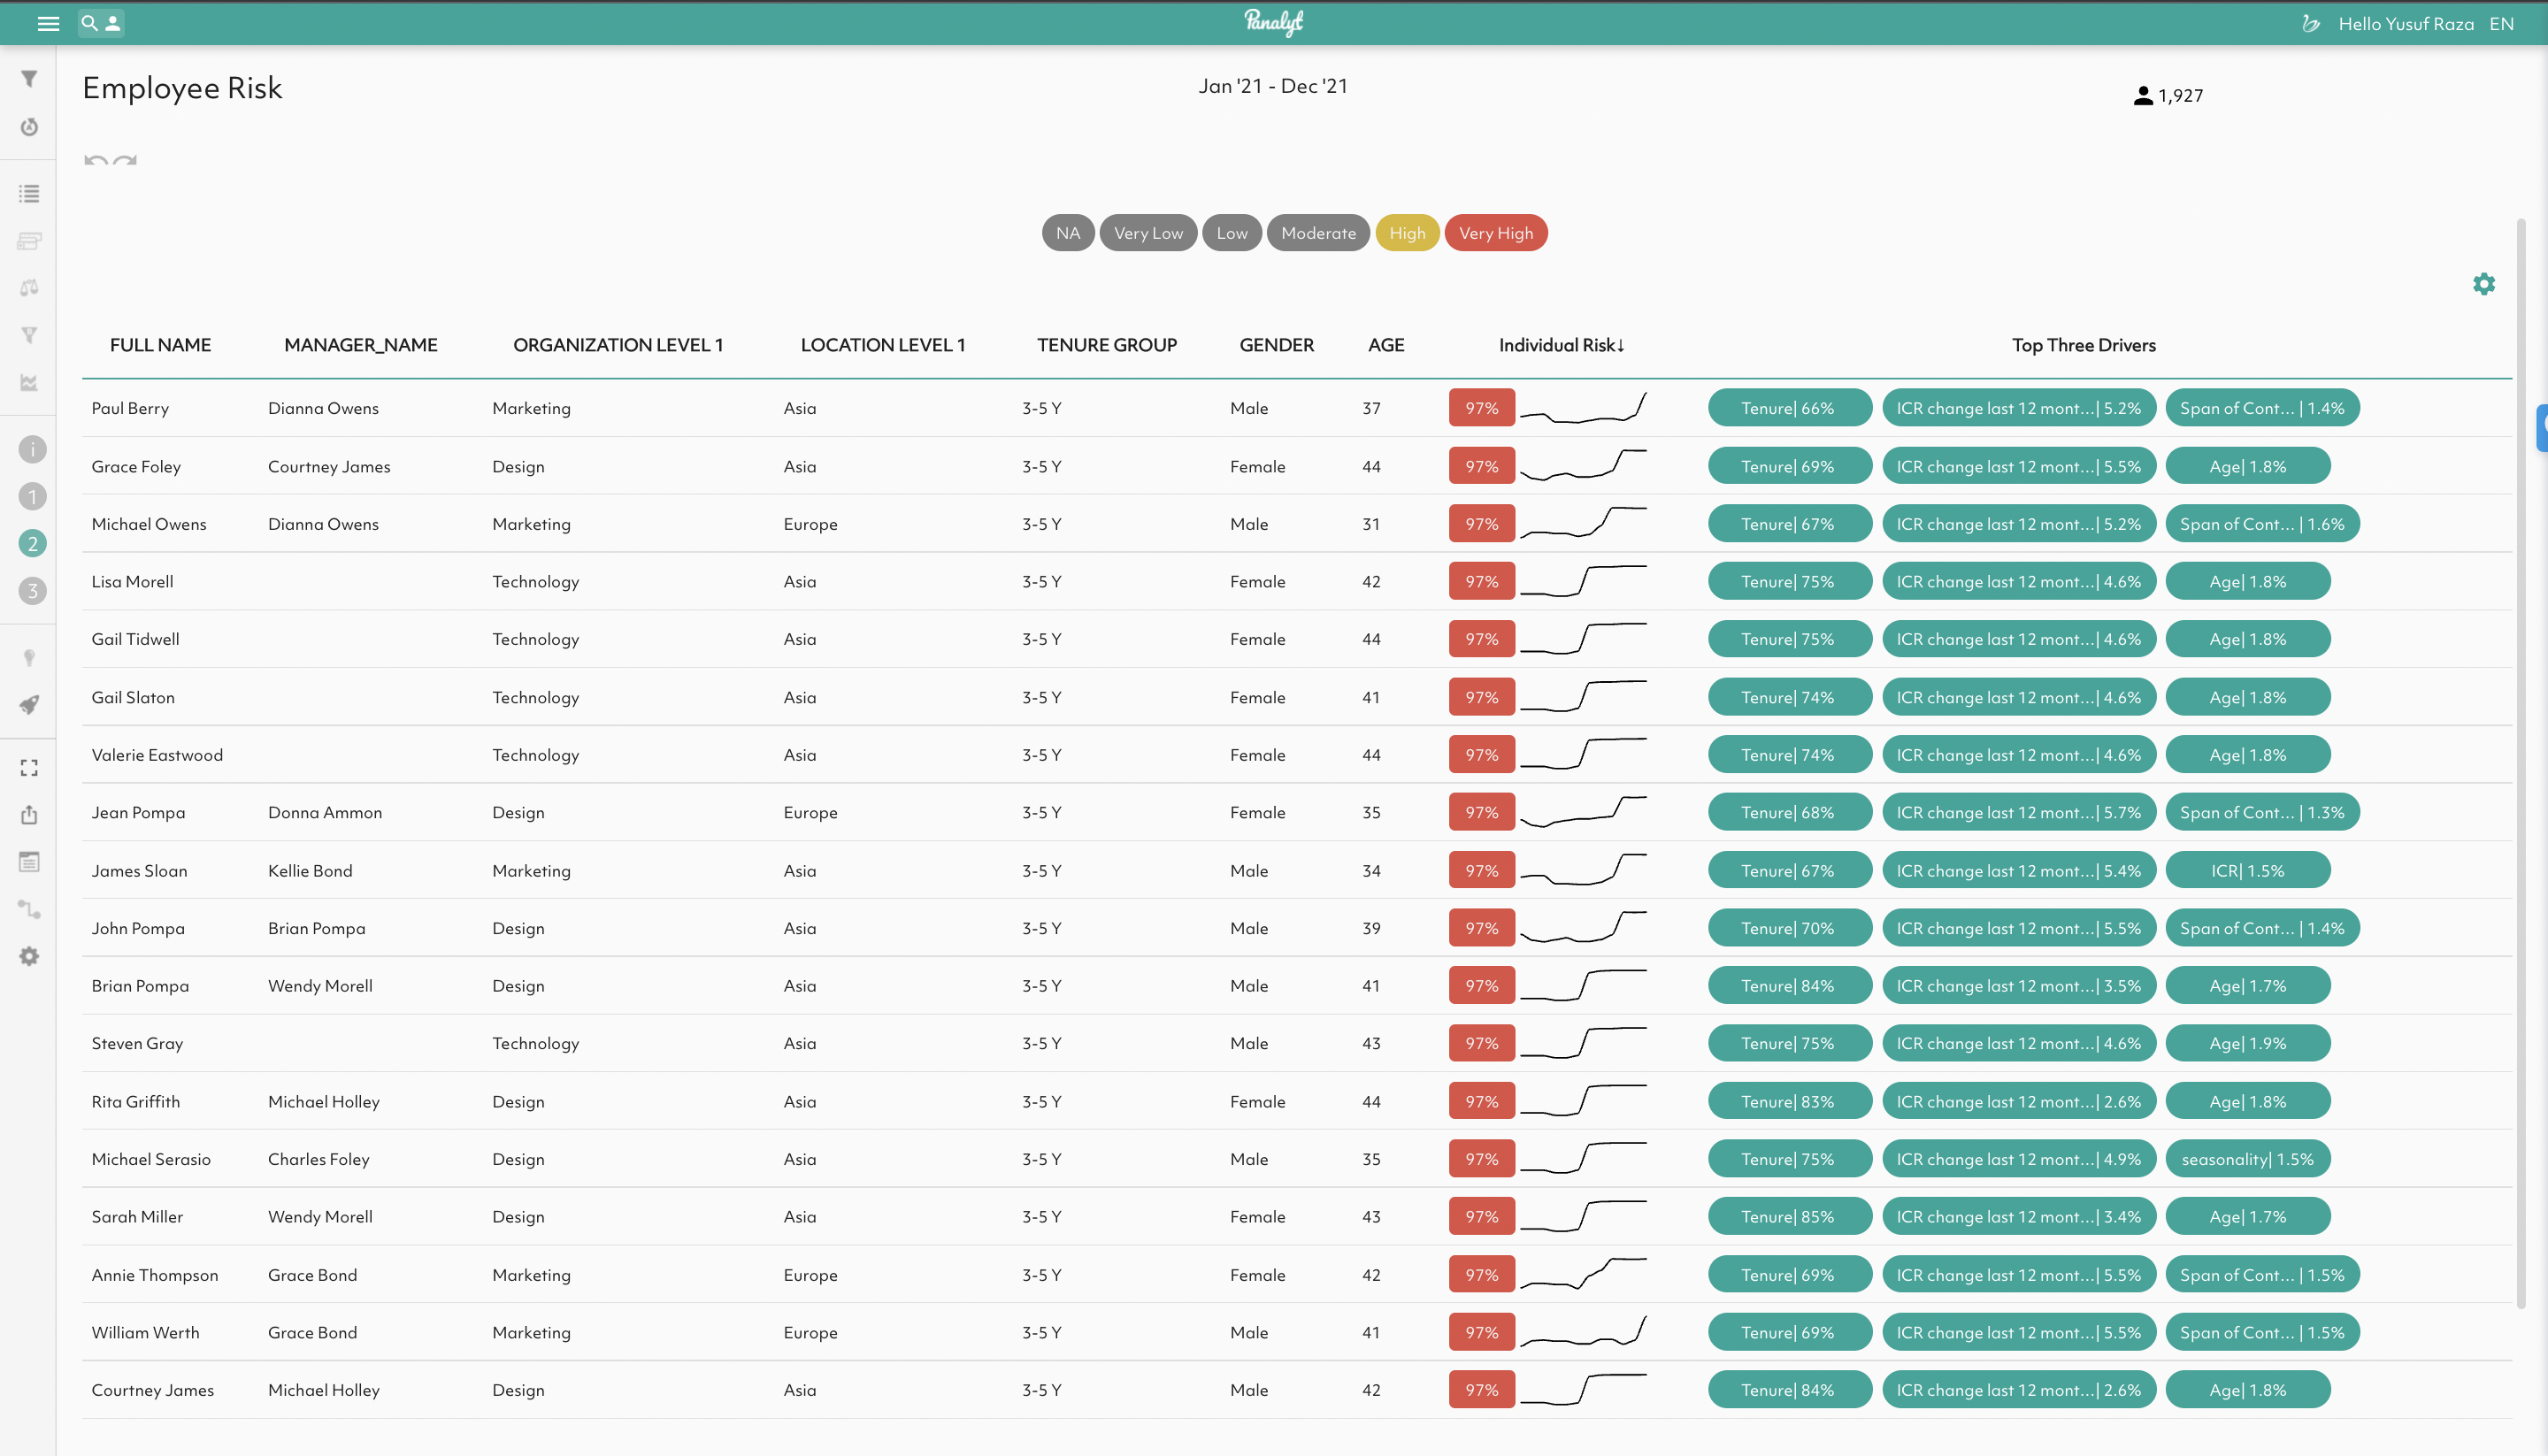
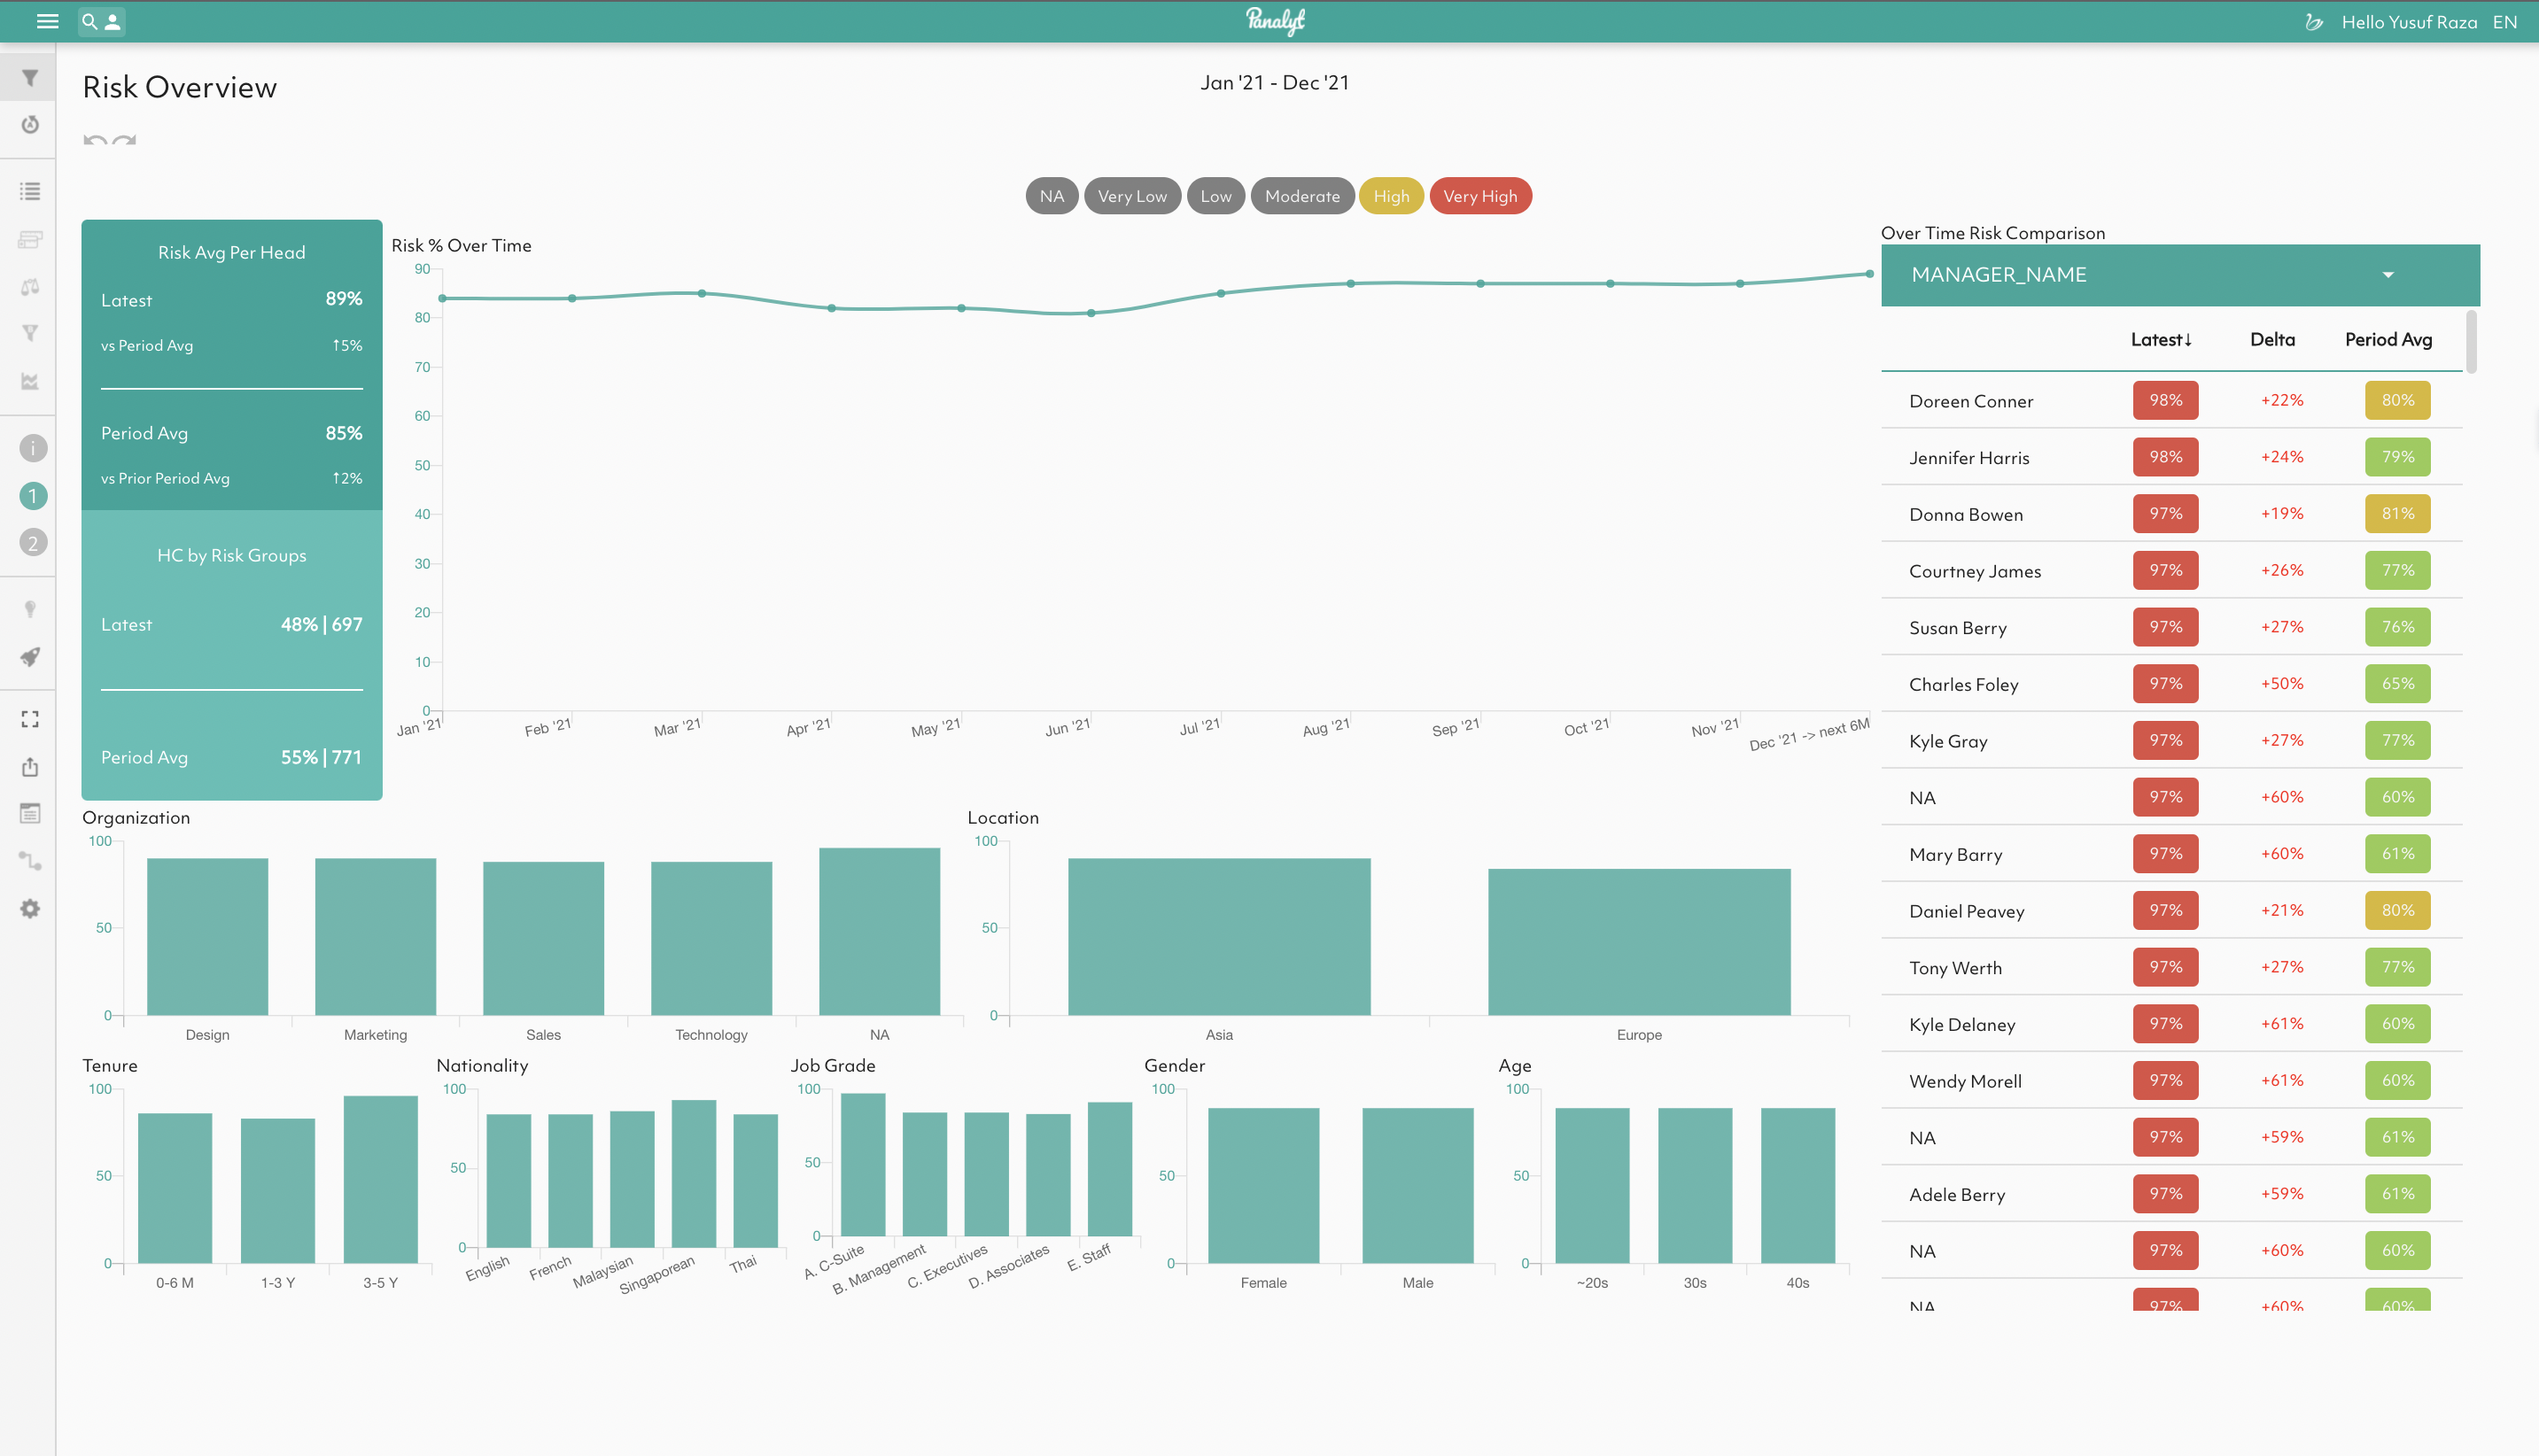
At Panalyt, we measure attrition risk by analyzing various demographic-based data points, such as age, gender, tenure, who’s the manager, how many managers you’ve had in the past year, the manager’s attrition rate, etc., in conjunction with Relational Analytics data on how connected employees are with the organization, their manager and their teams, allowing us to predict how likely someone is to leave the organization over the next six months and why. This model is trained over our entire client dataset and then fine-tuned to a client’s historical employee data.
This allows us to predict the Attrition Risk, the likelihood of an employee leaving in the next 6 months, and then visualize this information, both as a risk % and headcount at risk, across multiple dimensions such as by organization, department, tenure groups, etc.
Attrition risk, as we define it at Panalyt, can also be seen as a proxy for engagement risk/ loss of engagement over the next six months.
A deeper analysis of your attrition risk data lets you to see employee attrition risk profile by team, by manager, all the way down to risk profile by individual.

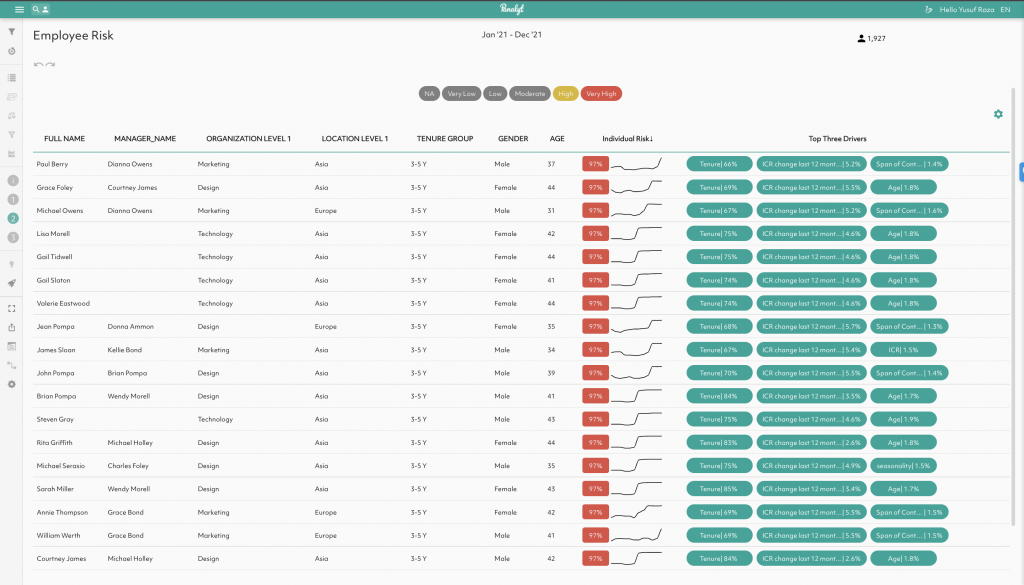
Once you’ve identified the level of risk, you can then drill down to what are the key drivers of the risk and identify leading indicators of the risk of people leaving. In most organizations we work with, there is usually a dominant driver related to specific organizational issues around diversity, compensation/lack of change in compensation, particular managers, etc.
HR teams can then interpret these drivers in the context of their organization to improve their understanding of possible risk factors for each employee/group of employees and then come up with a practical approach to mitigating risk based on their knowledge of what’s possible to implement. For example, coming up with initiatives to give top performers more facetime with senior leadership or designing an innovation program that lets people take time to do their own projects.
It is important to not confuse drivers with recommendations. For example, if the % of women in a team is a major risk driver, it may or may not be possible to move employees around, change the team structure, or hire externally to improve the % of women or team depending on your organizational context. Similarly, if Compa Ratio is a major risk driver, you cannot realistically do much if someone is at the top of their Compa Ratio and the Compa Ratio hasn’t changed in the past 12 months.
The ability to predict the attrition risk for each employee, along with a playbook for using this data in an ethical manner, can help empower HR departments and managers to change from a reactive mindset to a proactive approach for preventing key talent from leaving the company.
Understanding and Reducing the Snowball Effect of Attrition
The Snowball Effect of Attrition refers to people leaving as a result of being influenced by their close contacts around them leaving. This is very commonly observed when a software development manager or a sales manager leaves the company and poaches members of the team along with them.
Combining Relational Analytics with Attrition Risk predictions allows you to identify individuals who are at high risk of leaving, see who their key connections are and whether those key connections are connected to the rest of the organization.
If a high-risk manager has 4 direct reports who are not integrated with the organization beyond the high-risk contact, those individuals become isolated when the manager, their key connection to the organization and its culture, leaves.
Social ties play a big role in the spread of Attrition / Culture issues, and this approach enables companies to understand and mitigate the ripple effects of turnover.
Bonus: Utilizing Attrition Risk Data for Strategic EX Design
This section quotes Sasha Wight from Wrkflow from a past webinar “Strategic EX Design with People Analytics”.
” From an EX design perspective, if you are able to see a trend in your attrition risk data that one of the most common drivers of people being at risk is managers changing: you can use this insight to investigate how do we make the transition to a new manager process more meaningful and more personal to turn the employee experience during a manager change from a problem area into an experience that employees go through that is celebrated, enjoyed and drives engagement.
Another example focussed on improving Diversity & Inclusion is if you’re seeing that your female working population is at much higher risk of leaving the org, what design decisions do you need to make and what listening do you need to go out and do.
Once you spot markers due to which female employees are at higher risk of leaving the organization, you can to your employees about factors and really understand what is it that is driving that risk, and validate that the data is accurate as well.
Having hard data points on who is at the highest level of risk, and then combining that with listening is key.
Understanding which factors are driving high attrition risk allows you to focus your time on where it’s going to produce the best results and drive discussions focussing on the right areas to validate the findings.
Rather than covering a laundry list of questions in your surveys, you can now focus your surveys on real and clearly defined problem areas to get richer insights into why people might be leaving your organization.
It is important to understand the nuances in the symptoms of attrition risk when designing EX interventions – if there is a decline in the relationship score/ or the number of relationships for an individual, is it an outcome of a change in behavior by the individual or is it a change in the behavior of their team affecting them?
Some of the data points used to drive the attrition risk calculation are just facts/ attributes, things you can’t change but help you define the population you are talking to. It might also be that you’re seeing that a lot of people are at risk, but the drivers are less about things your organization is doing to push, but rather more pull factors.
For example, at the time when people naturally progress from your organization – how can you ensure that your offboarding experience is a good one? If you’re getting to a natural churn rate of people who have joined org 5-6 years ago, how can you make sure you are involving them in the offboarding process and making sure that it is one that is positive?”
Effective Knowledge Sharing to Replace Someone Leaving the Organization or Changing Roles
Even though organizations can adopt proactive measures to reduce turnover and improve engagement, there will always be employees leaving the organization.
Relational Analytics can help reduce the unwanted effects of turnover by improving the new hire time to productivity through strategic network plans to build organizational knowledge based on the network of their predecessor in the role.
A heavily neglected aspect of off-boarding plans when a high-performing employee leaves or changes role is understanding who were the people/relationships that enabled that employee to succeed in their role.
This information can then be used to create a tailored onboarding network development plan for new hires and help them be in a better position to succeed in their roles.
Traditionally we expect new hires in a role to navigate the organization using the organization chart, or help them to do so, despite knowing that the org chart doesn’t necessarily tell who are the people enabling high performers to succeed in their roles.
For example, just connecting a newly hired CFO to the rest of the C-suite might not be enough for the new CFO to understand which employees they’ll be relying on for their day-to-day activities.
A better understanding of organizational networks/ relationships enables organizations to ensure that new hire has the right relationships needed to thrive in the organization, and also improve new hire time to productivity from the organization’s perspective.
We hope you found this guide useful and can practically apply these insights to improve employee retention at your organization!
At Panalyt, we are working with several global clients like Panasonic and Coca-Cola FEMSA on a wide range of analytical use cases including predicting attrition/disengagement risk and understanding drivers, improving the quality of hire, accelerating new hire time to productivity, and many more.
Schedule a quick 30-minute introduction call with our founders to learn more at https://calendly.com/panalyt/djw-yr-30