Four months to unify HR, attendance and payroll data — and start answering executive questions at the level of the whole organization
Four months to unify HR, attendance and payroll data — and start answering executive questions at the level of the whole organization
Executive summary
1. Before Panalyt: no foundation for answering questions about the organization as a whole
At Kameda Seika, every executive question about people data used to trigger the same routine: extract data from several systems, reshape it, recalculate. Each analysis answered that one question and was hard to reuse for the next. The existing systems could not keep up with the number of questions coming from the leadership, or the pace at which they arrived.
Behind this was a difference in what each system had been designed to do. Kameda Seika had introduced a talent management system years earlier, and its records on each employee were in good order. Most executive questions, however, are questions about the whole: across the organization, which groups are showing what? A system built to capture individuals in detail and a system built to survey an entire organization are designed for different jobs. Having good records on every individual is not the same as being able to answer a question about the organization.
Talent management and Panalyt
A talent management system exists to manage and develop individuals. Panalyt exists to ask what is happening across the organization and to connect the answer to management decisions. Kameda Seika did not replace the first with the second — it added the second. With both in place, the company can survey the organization to find where an issue sits, then drill down to the individuals concerned and act on it. Discovery and action sit on a single line.
Kameda Seika also needed to show how its investment in people was contributing to earnings, as part of a wider push to raise the value the business creates. HR data and financial data, however, sat in separate systems at different levels of granularity, which made productivity difficult to quantify by organizational unit.
And as the group pursued its ONE KAMEDA strategy, systems and data formats differed from company to company, leaving no common foundation on which to discuss HR strategy across the group.
2. How the project ran: what made four months possible
Three steps, taken by both companies
Data integration is not something we do to a client. From aligning definitions through to implementation, every step calls for decisions on the client’s side. Our project with Kameda Seika followed three steps.
- Align on the definition of each metric
We bring a set of pre-built calculation formulas, and Kameda Seika checked them against its own definitions. Which formula has the company been using until now? Which version actually answers what it needs? HR metrics subject to disclosure rarely come with a single prescribed formula, and companies often carry forward their own logic simply because that is how it has always been done. This step doubles as an opportunity to revisit that logic and arrive at numbers the company can trust. - Map Kameda Seika’s data to our fields
We worked through the data coming out of the existing systems together with Kameda Seika and mapped each item to the corresponding field in Panalyt. - Decide how to handle the exceptions
Implementation always surfaces values that fall outside the assumed logic, along with practices unique to the company. In each case, we asked Kameda Seika how the practice actually worked, then proposed an approach drawn from previous implementations. Kameda Seika made the call, the logic was fixed, and the metric went live.
What sets the lead time: how well a company knows its own data, and how fast it decides
Each step asks the client to prepare data, to know that data well, and to think through and decide on the exceptions. The faster each of those happens, the shorter the lead time. Kameda Seika stood out on every one of them.
Our playbook of metrics and accumulated know-how met Kameda Seika’s deep understanding of its own data and its speed in making decisions. That combination is what brought onboarding to completion in roughly four months.
3. What the data showed
As soon as onboarding was complete, three People Questions were set against the newly integrated data, and we presented the findings to Kameda Seika’s executive team.
- Turnover — which groups are leaving, when, and why
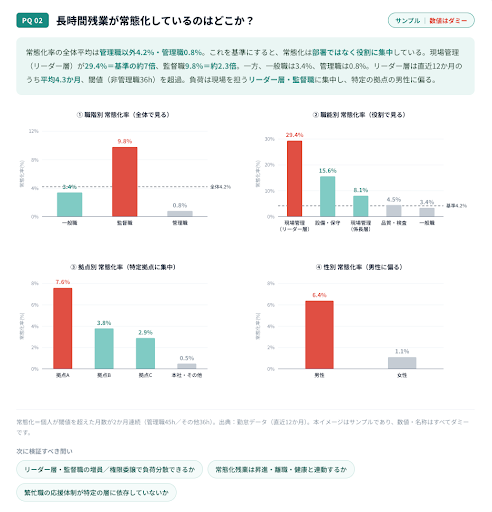
- Chronic overtime — how employees above the threshold are distributed across the organization
- Women in management — what stands between today and the 30% target set for 2030
All three were first-pass analyses on a single year of data, but the findings were already pointed.
- Turnover appeared in the overlap of job type and tenure, not in the company average.
Turnover across the company as a whole is low. Within that, one job type and one tenure band overlapped to form a clear concentration. The discussion moved straight to why people leave at that particular point, and the next question to test was defined on the spot. - Long hours followed roles, not departments.
Viewed by department, nothing stood out. Viewed by role, the hours concentrated in specific roles. - For women in management, the issue was the transition, not the entry point.
The gender balance at the point of hiring shows no significant gap. The obstacle lies in the move from the specialist track to the management track. Against the 30% target for 2030, the question itself changed: hire more, or redesign how people are developed?
When the data foundation is in place, the very first analysis can move on to what to look at next. In this case the session went as far as identifying the additional data needed to test the hypotheses that had emerged.
We connect data scattered across existing systems, clean it, and turn it into metrics a company can see. Only on that foundation do insights become something a company can act on.
4. What comes next: from labor cost as an expense to labor cost as capital that returns a profit
The next theme for Kameda Seika is productivity.
Until now the company could see where its spending on people went, but not how much of it came back as profit. Connecting financial data to HR data makes a new set of questions answerable: how much contribution profit does one yen of labor cost generate, and how far does that vary between organizations? When a plan falls short, is the cause headcount, productivity, or how people are deployed?
Kameda Seika will also extend the data foundation behind ONE KAMEDA to its group companies. Because systems and formats differ across the group, the plan is to start with a single company as a model case and expand from there.
The foundation for answering executive questions about the organization as a whole is now in place. Next, Kameda Seika will use it to talk about people and profit in the same numbers.
Managing Executive Officer, General Manager of Human Resources & General Affairs Division, KAMEDA SEIKA CO., LTD.
We had always been able to manage information on individual employees. What we did not have was an environment that could answer, quickly, the questions our executives were asking: what is happening across the organization, and how is our investment in people connected to business results? To take human capital management and group management further, we needed to integrate our data and build a foundation we could use for management decisions. That was when we came across Panalyt.
In about four months we integrated our HR, attendance and payroll data, and we are now analyzing turnover, long working hours and the promotion of women into management on the basis of that data. Discussions that used to rest on intuition now rest on fact, and we can see where the issues sit and what to examine next. That, to me, is a significant result.
Next we want to connect HR data with financial data and make visible what value and what profit our investment in people generates. We also intend to extend the foundation we have built to our group companies and develop it into a shared platform for human capital management across ONE KAMEDA.