Interested in learning how you can leverage your internal communications and digital collaboration networks to build more collaborative and high-performing remote organizations? Check out our webinars on this topic at www.panalyt.com/webinars
“The Times They Are a’ Changin’ “- Bob Dylan
The recent global outbreak of Covid-19 has affected almost every aspect of our day to day, including how we work. More and more companies have switched to completely remote operations and this has resulted in a fundamental change in managing teams.
You can’t micromanage a remote team. The only way the switch to remote will work for you is to
empower your employees to manage themselves and to communicate effectively with their teammates.
Some employees might thrive in such an environment, some might struggle immensely, and it is up to you to identify and help employees in need of help making the transition.
Leveraging Organizational Network Analysis to understand how your team works remotely can help you empower your company to be more effective in making the transition to working remotely during these challenging times.
This article goes into the details of how.
Organizational Network Analysis(ONA)is one of the hottest buzzwords in the people analytics sphere currently. Basically, it refers to using various statistical and graph theory techniques traditionally applied to social networks to view an organization as a social graph of the interactions between employees rather than the just traditional hierarchical organization charts, to uncover hidden, yet crucial insights about your organization.

Wait, what? Basically, you can use data from your internal communications and collaborations tools to map your organization’s virtual social network and build a more efficient, collaborative and inclusive organization. As we rapidly move towards a more digital workforce where remote work and digital interactions play a key role in shaping company culture and innovation, there is a pressing need for organizations of all sizes to be able to leverage their informal network data and understand how it impacts productivity, collaboration, employee engagement, performance, attrition, burnout etc.
I’ll address the elephant in the room before exploring the use cases in depth.
If you think applying ONA means going all Big Brother on your employees, THIS IS NOT GOING TO END WELL FOR YOU.
Unlike some of the major ethics scandals related to data that have been all over the news recently, it doesn’t take a congressional investigation to uncover what your company is doing with employee data. Word goes around quickly both within and outside companies and once your employees realise their data is being analysed for the wrong use cases, you are going to end up with a big employee satisfaction and attrition problem and your employer brand’s trajectory can be best summed up by this scene from one of my favourite movies.
While I think the ethical aspect of people analytics and applying AI to employee data is self-correcting by itself, here’s an article by renowned people analytics expert Josh Bersin on that note: https://joshbersin.com/2019/05/the-ethics-of-ai-and-people-analytics-four-dimensions-of-trust/.
Also, keep in mind that not every interaction between people in a company is recorded on a system. ONA is meant to help you identify collaboration patterns within your company but your inference should be drawn in conjunction with day to day observations and peer feedback.
A commonly cited example is that of top sales, product and customer success talent usually being well connected to different departments so that they can easily access information from the relevant person when required. Be smart about how you apply such nuggets of information though- the same inference won’t necessarily apply to high performing software engineers.
Now that’s out of the way, let’s dive in deeper into how you can get started with ONA and what you can do with it.
The next few sections talk about what each step of the process entails and the different questions you can answer at each step.
I like to view implementing ONA as a four step process when it comes to the analytics:
- Data Collection
- Statistical Analysis
- Advanced Analysis based on Graph Theory and Machine Learning
- Continuous improvement
Data Collection
There are two kinds of data when it comes to ONA:
- Active– This refers to data collected through surveys sent out to employees asking who speaks to whom and why etc.
- Passive– This refers to data collected directly from digital systems used such as email, chat and calendar tools.
Active data usually has a recency bias while passive data only captures information from different systems so the best results are usually obtained when both methods are used in conjunction along with your own observations. However, I’ll limit the scope of this article to passive data.
The process involved usually entails informing employees about what data you’re extracting , what data you’re reporting on and why( legal regulations in some places might require employee opt-in), connecting to data from different tools either via APIs or exports and finally keeping only the metadata(who sent to whom and when) to ensure the actual contents are still confidential.

Statistical Analysis (i.e. stuff you can do on Excel yourself once you have the data )
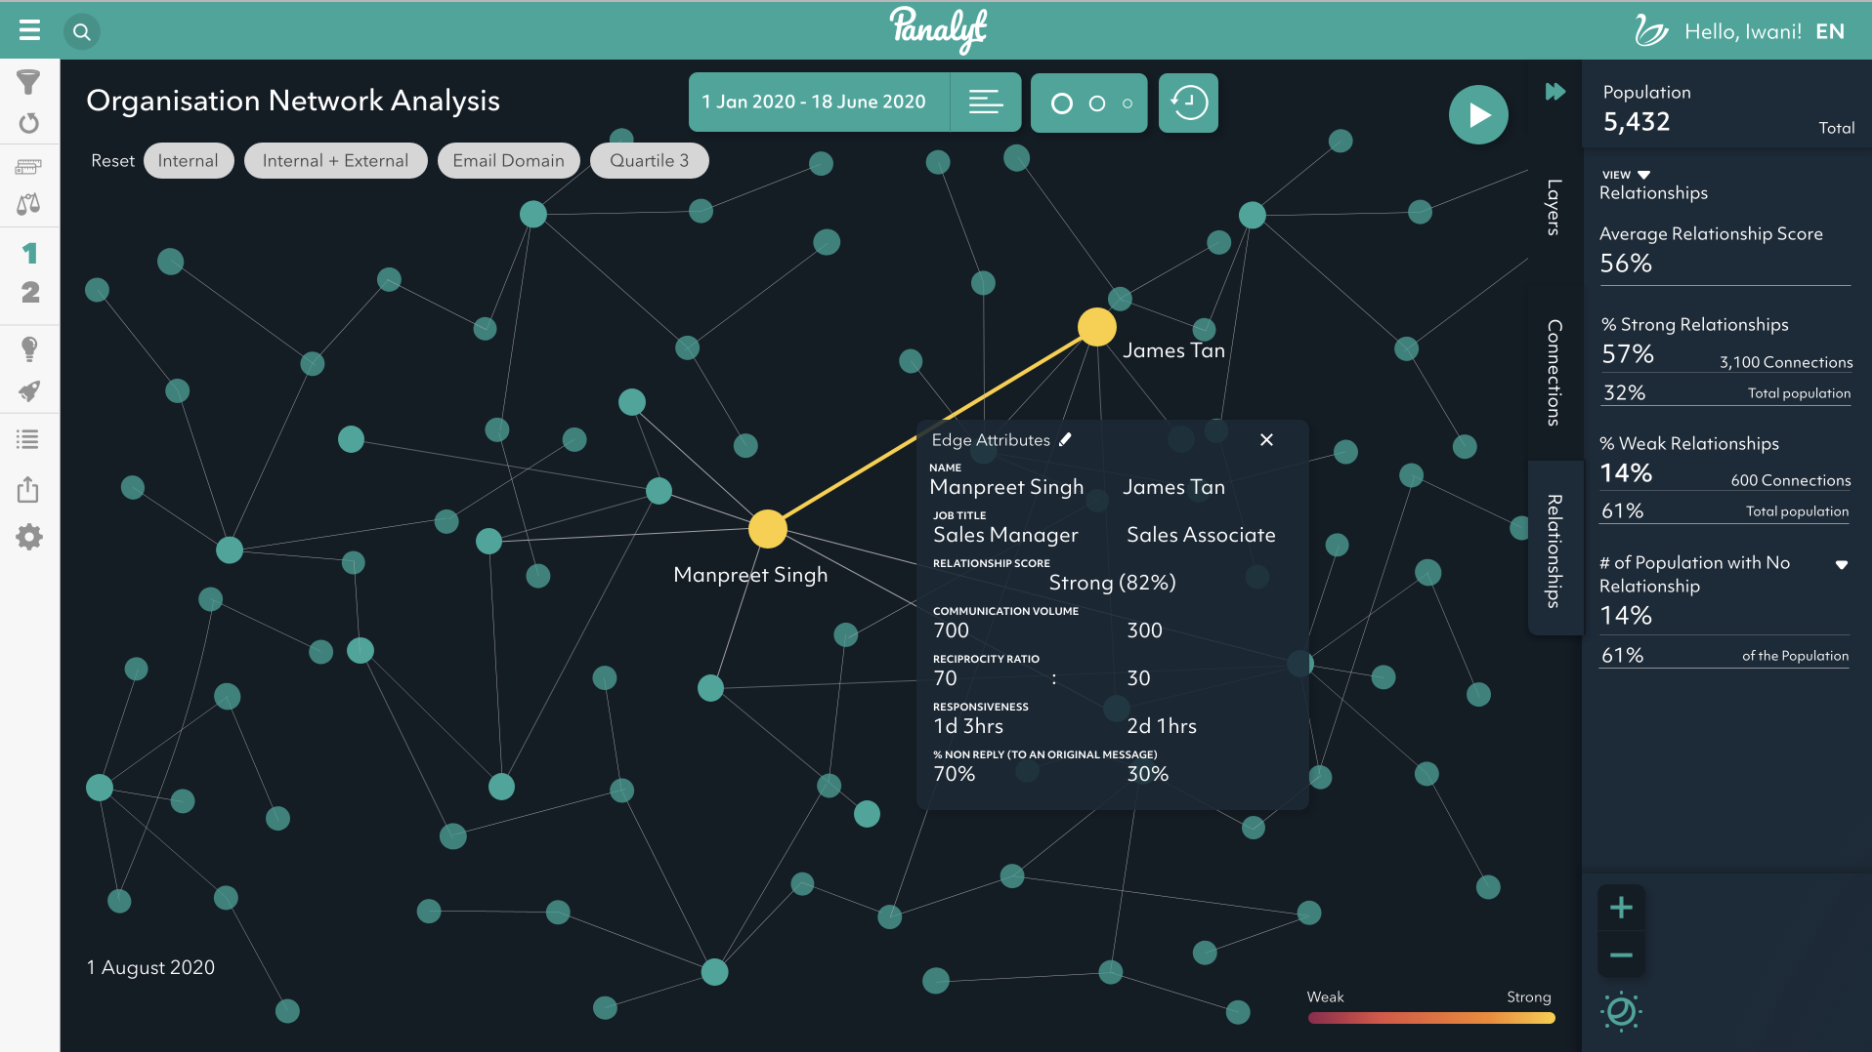
The most basic level of analysis once you extract the network data is to see who is talking to/ collaborating with whom and when. This can be used to identify employee burnout and disengagement by answering the following questions:
- How many emails are being sent outside work hours and by whom?
- How accessible are managers? How much 1–1 time do employees get with their manager/ upper management and how often?
- Which employees are more/ less engaged than average both within/ outside their immediate teams?
- How often are meetings been scheduled and how effective are they? How many people are multitasking during meetings or are double booked for meetings? What is the total time of your organization being lost to meetings? Is there a correlation between time spent in meetings and performance?
These simple metrics when benchmarked against high-performing teams or against people who’ve left can help get you started on your ONA journey.
Advanced Analysis based on Graph Theory and Machine Learning( i.e. stuff you need a dedicated data science team for)
This is where things start to get interesting. Using graph theory, you can identify which employees in your network act as central nodes/ hubs of information, identify silos and which employees act as bridges/ knowledge brokers between silos and which employees are peripherals in the graph/ likely to be disengaged and leave the company. The following diagram gives a better picture of the terminology:

- Central Nodes– These people are very well connected and engaged with others and act as information hubs, usually collaborating with and advising a lot of people around them.
- Knowledge Brokers– These people connect and act as bridges between different silos.
- Peripherals– These people are not well connected to others in the organization, and hence at risk of being disengaged, feeling not valued and hence leaving the company.
Identifying these employees and co-relating it with other sources of people and productivity data in your company helps answer the following questions:
- Who are the central nodes and knowledge brokers not recognised in formal organization structures and performance reviews?
- What enables highly collaborative individuals to be more engaged with others and how to elevate more people to those positions to make a more engaged organization, while at the same time reducing the risk of burnout and planning for a contingency in-case central nodes/ knowledge brokers leave?
- Which employees are peripherals and at risk of leaving the company? Who can help these peripherals/ new hires be connected to more people and be more integrated into the company?
- Where are different cliques forming in your organization and what is the ripple effect of a certain employee leaving or spreading dissent?

- What are the communication behaviours common in high performers for different roles? How can you recognise people showing these behaviours and use it as an additional data point while considering internal transfers and promotions?
- Who will be the most effective to help propagate organizational transformation and culture change decisions?
- How inclusive is your organization? How well-connected are your female, minorities, LGBT employees as compared to the average employee? Are you just diverse on the surface but nowhere close to inclusive in reality?
- How can you streamline information flow in your organization by reducing redundant nodes and breaking down silos?
Burnout,Collaboration, Diversity and Inclusion, Change Management, Post-Merger integration… the laundry list of possible use cases for ONA is never ending.
While such analysis uncovers a wealth of insights previously unknown to an organization, the challenge lies in making an interface that is easy to use for the average manager while at the same time delivering the insights mentioned above and this is something we at Panalyt pay utmost attention to!

Here’s Panalyt CEO Daniel West talking about how Uber used Organizational Network Analysis to improve the productivity of their Sales team and better onboard new Sales reps!
Continuous Improvement
It is necessary for HR and senior management to understand what are the drivers to enable a more connected workforce and implement training sessions to coach disengaged employees to adopt behaviours in-line with high performers/ the company’s desired communication culture.
Moving to a more data-driven HR function means continually running small experiments, analysing the results for what works ad what doesn’t and using feedback loops to build a better next set of experiments.
Sounds pretty similar to modern growth teams doesn’t it?

If your people analytics function is advanced enough, you can apply machine learning models on historical employee data to simulate the effects of tweaking a few parameters on core talent focus areas.
As mentioned before, it is of utmost importance that an organization uses such analytics to drive more positive employee behaviours to maximise employee engagement and satisfaction, rather than using it as an Orwellian surveillance tool.
I hope this article has given you an overview of how you can leverage informal networks in your organization and the implementation process required to get started!
At Panalyt, we help companies derive actionable insights from data stored across internal systems in companies and drive business results through data-driven people decisions.
Understanding your internal networks in the context of the rest of your people data was never this easy!

Do you use GSuite, Slack, Workplace by Facebook, Microsoft Teams etc. and want to leverage your internal communications and digital collaboration networks to build more effective remote teams?
Reach out to me at yusuf@panalyt.com if you want to have a detailed discussion around this topic or want to learn more about the field of people analytics in general.
Co-Founder and Head of Growth, Panalyt
Check out our webinar https://www.youtube.com/watch?v=chOZPdznlAAto learn more!
About Panalyt
Panalyt bridges the People-Data Gap, enabling real-time, uniform access to relevant people data, reports, and insights for CxOs, HR, and business managers.
People data, including employee interactions and connections, is combined with business data empowering businesses to leapfrog to data-driven decision making, eliminating bias and improving engagement, sales effectiveness, productivity, and, as a result, business performance.
Interested in a further discussion on how People Analytics and Relational Analytics can help you drive an improved employee and business outcomes? Book a 30-minute discovery call with our Panalyt co-founders to learn more!